How to Customize HubSpot Dashboards for Actionable Insights
Anisha

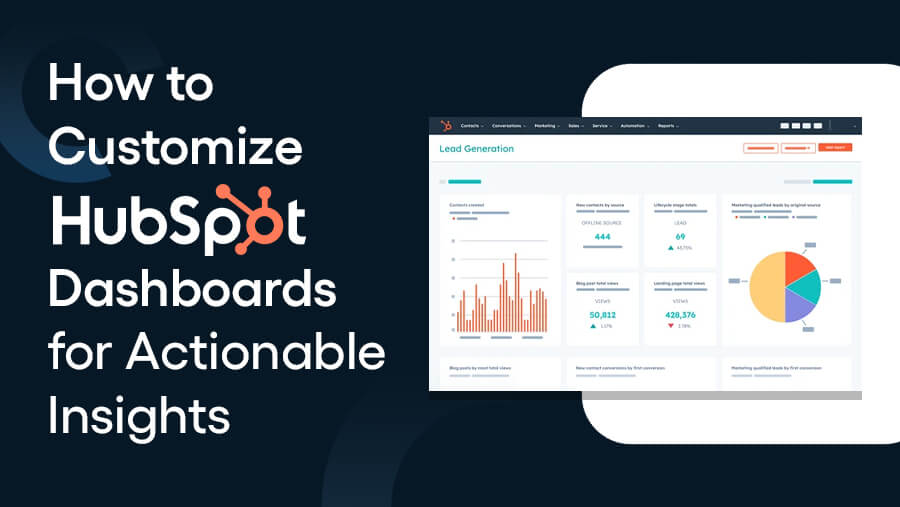
When you open your HubSpot account, wouldn’t it be great to see all the data you need in one place—organized, clear, and easy to act on? No unnecessary reports, no wasted time hunting for numbers—just the insights you need to make informed decisions immediately.
That’s the power of a customized HubSpot dashboard. Beyond displaying data, it’s a tool that helps you focus on what really matters to your business.
In this article, you’ll learn how to customize HubSpot dashboards in simple steps. Whether you’re tracking sales, marketing campaigns, or customer support performance, you’ll see how easy it is to set up dashboards that deliver real, actionable insights.
What Are HubSpot Dashboards?
HubSpot dashboards are your go-to place for tracking, analyzing, and understanding your business's performance. They bring all your data together in one view so you can make informed decisions quickly and easily.
Here’s a quick overview of what you can do with HubSpot dashboards:

Key Features of HubSpot Dashboards
- Customizable Layouts: Add/rearrange/resize reports to create tailored dashboards.
- Multiple Dashboards: Create multiple dashboards for different teams or purposes. Interactive Reports: Drill into reports to uncover detailed insights.
- Automation: Update automatically, so your data is always current.
- Easy Collaboration: Share dashboards to keep all teams on the same page.
Types of Data HubSpot Dashboards Can Display
- Sales Data: Track deals, revenue, and pipeline progress.
- Marketing Metrics: Monitor website traffic, email campaigns, and lead generation.
- Customer Service Insights: Measure ticket resolution times, customer satisfaction scores, and support team performance.
- Operations: Analyze productivity, tasks, and workflow efficiency.
With these features and data types, HubSpot dashboards make it easy to stay on top of your business’s activities—all in one place.
Why Customize HubSpot Dashboards?
Every business is unique, and a one-size-fits-all dashboard won’t always give you the clarity or insights you need. Here’s why customization matters:
1. Align Data with Business Goals
When your dashboard reflects your specific goals, you can focus on the metrics that truly matter. Whether tracking monthly sales targets, monitoring campaign performance, or improving customer service, customization ensures your data stays relevant.
2. Improve Decision-Making with Relevant Metrics
A customized dashboard helps you filter out the noise and hone in on the key metrics—
- Conversion rates
- Deal progress
- Ticket resolution times
—that drive smarter, faster decision-making.
3. Simplify Data Interpretation for Your Team
A cluttered dashboard can confuse your team. You create clear, focused, and easy-to-understand dashboards by tailoring the layout and content. This means your team spends less time figuring out what the data means and more time acting on it.
Steps to Customize HubSpot Dashboards
Now that you understand the importance of customization, let’s take you through the steps to create tailored HubSpot dashboards:

1. Access the Dashboards
- Navigate to HubSpot’s dashboards by selecting the Reports section in the main menu.
- Identify the type of dashboard you want to work with:
- Default Dashboards: Pre-configured by HubSpot with common metrics.
- Custom Dashboards: Created to suit your specific business needs.
- Understand the purpose of each dashboard to ensure you start with the correct one for customization.
2. Select the Right Dashboard Template
- Pre-Built Templates:
- HubSpot offers ready-to-use templates tailored for different functions like sales, marketing, customer service, and operations.
- Evaluate the templates to choose one that aligns with your business goals.
- Templates are helpful for users who want quick, functional dashboards without starting from scratch.
- Start from Scratch:
- Opt for a blank dashboard if you need complete control over the layout and metrics.
- Ideal for teams with unique KPIs or advanced reporting needs.
- Consider combining elements from pre-built templates and custom dashboards for a hybrid approach.
3. Add and Customize Reports
- Add Different Report Types
- Choose from a variety of pre-built or custom reports to match your business needs:
- Sales Metrics: Track key indicators like deal progress, revenue forecasts, or pipeline performance.
- Marketing Analytics: Analyze campaign effectiveness, lead conversion rates, and ROI.
- Customer Service Insights: Monitor ticket resolution rates, customer satisfaction scores, and response times.
- HubSpot offers a library of standard reports, or you can create unique reports to address specific KPIs.
- Choose from a variety of pre-built or custom reports to match your business needs:
- Customize Reports for Relevance
- Adjust Filters:
- Fine-tune the data displayed by applying filters such as date ranges, deal types, or campaign identifiers.
- Use dynamic filters to enable real-time data exploration.
- Select Data Sources:
- Ensure reports pull from the correct data, like contact properties, deal pipelines, or campaign analytics.
- Integrate external data sources if needed.
- Use Visual Widgets:
- Choose visual elements like bar graphs, pie charts, tables, or line graphs for easier data interpretation.
- Match the visual format to the data type (e.g., trends in line charts or comparisons in bar graphs).
- Adjust Filters:
4. Organize the Layout
- Use the Drag-and-Drop Interface
- HubSpot allows you to easily move and position reports for a logical arrangement.
- Drag and drop widgets to prioritize important data at the top and less critical insights lower down.
- Group Similar Reports Together
- Arrange related metrics into clusters for a cohesive structure.
- Example: Place sales metrics at the top, marketing performance in the middle, and customer service insights at the bottom.
- Grouping helps users quickly locate and interpret data without navigating through unrelated sections.
- Arrange related metrics into clusters for a cohesive structure.
- Resize and Align Widgets
- Resize widgets to ensure larger reports, such as revenue forecasts, take prominence.
- Align and balance the layout for better visual appeal and readability.
- Add Spacers or Dividers
- Use blank spaces or lines to separate different sections, making the dashboard cleaner and easier to scan.
- This is particularly helpful for dashboards containing a mix of reports across multiple departments or metrics.
5. Leverage Advanced Features
- Set Up Dynamic Filters
- Add dynamic filters that let viewers refine data in real-time based on criteria such as date ranges, regions, or specific campaigns.
- Enable interactivity so team members can personalize their view without modifying the original dashboard.
- Automate Dashboard Updates
- Use HubSpot’s automation features to ensure reports pull the latest data automatically.
- Reduce manual effort by setting dashboards to refresh at regular intervals or when new data is added.
- Embed External Links and Notes
- Link to external tools, documents, or webpages for additional context (e.g., campaign plans or sales scripts).
- Add notes or annotations to highlight key insights, trends, or instructions for dashboard users.
- Use this feature to make dashboards more actionable and informative for viewers.
6. Use Sharing and Permissions
- Share Dashboards with Specific Teams
- Grant access to relevant teams or individuals based on their roles:
- Sales Teams: Share sales performance dashboards to help them track quotas and deals.
- Marketing Teams: Provide access to campaign analytics dashboards to optimize strategies.
- C-Level Executives: Deliver concise, high-level dashboards with key business metrics.
- Grant access to relevant teams or individuals based on their roles:
- Assign Permissions
- Define user roles to control who can interact with dashboards:
- View-Only Access: Allow stakeholders to view insights without the ability to edit or modify.
- Edit Access: Provide team members who maintain or update dashboards with editing rights.
- Define user roles to control who can interact with dashboards:
- Manage Privacy Settings
- Protect sensitive data by adjusting privacy controls.
- Restrict access to dashboards containing confidential or proprietary information to specific users or teams.
- Use password-protected or private dashboards when dealing with high-security data.
7. Monitor and Update Regularly
- Review Dashboard Performance
- Schedule periodic reviews to ensure your dashboards remain aligned with current business goals.
- Assess whether the displayed reports provide actionable insights or if adjustments are needed.
- Replace Outdated Reports
- Identify and remove metrics or KPIs that are no longer relevant to your strategy.
- Replace outdated reports with updated ones that reflect new objectives or changes in data sources.
- For example, swap metrics from a past marketing campaign with those from a current initiative.
- Collect Team Feedback
- Regularly gather input from dashboard users, including team members and stakeholders.
- Use feedback to enhance usability by:
- Adding missing reports or KPIs
- Reorganizing layouts for easier navigation
- Improving report clarity or visual presentation
- Encourage collaboration to ensure all critical insights are accurately represented.
Tips for Creating Actionable Dashboards
A great dashboard turns your data into insights you can act on. Here are some practical tips to ensure your HubSpot dashboards are as actionable and effective as possible:
1. Focus on Key Metrics
Identify the key performance indicators (KPIs) that align with your business goals and focus your dashboard around them.
For example, prioritize metrics like deal progress, revenue growth, and conversion rates if your goal is to boost sales. This ensures your dashboard drives the right decisions.
2. Avoid Clutter
A cluttered dashboard can overwhelm rather than inform. Keep it clean and simple by including only the most relevant reports.
Too many widgets and data points can dilute focus and make it harder to extract actionable insights. Stick to what matters most and organize the layout for easy scanning.
3. Use Visuals
Charts, graphs, and visual indicators make your data easier to interpret at a glance.
For example, a bar graph showing deal stages or a pie chart breaking down lead sources can convey complex information more effectively than plain numbers.
Visuals help you and your team quickly identify trends and patterns.
4. Set Up Automation
Manual updates are time-consuming and prone to errors. HubSpot dashboards can automatically pull and refresh data in real-time, so your reports are always up-to-date.
Automation ensures you’re always looking at the most accurate and current information, enabling faster and better decisions.
Examples of Actionable Dashboards
Here are three examples of how HubSpot dashboards can be customized for specific business needs. Each is designed to provide actionable insights at a glance:
1. Sales Performance Dashboard

Track sales activities, improve team productivity, and identify pipeline roadblocks with real-time insights.
- Key Metrics:
- Deal Forecast: Predict future revenue with projected deal values.
- Sales Pipeline: Monitor deals at each stage to spot bottlenecks.
- Closed Deals vs. Goals: Track progress toward sales quotas.
- New Leads: Measure lead inflow from channels like website forms or campaigns.
2. Customer Success Dashboard

Gain customer insights, enhance experiences, and proactively reduce churn to boost loyalty.
- Key Metrics:
- Net Promoter Score (NPS): Measure customer loyalty on a 0–10 scale.
- Customer Churn Rate: Monitor the percentage of customers leaving within a timeframe.
- CSAT Scores: Analyze customer feedback to gauge satisfaction.
- Renewal Rates: Track subscription or contract renewals as a sign of loyalty.
3. Marketing Analytics Dashboard

Evaluate marketing performance and optimize campaigns for higher ROI.
- Key Metrics:
- Website Traffic Sources: Track traffic from organic search, ads, or other channels.
- Email Campaign Performance: Measure open, click-through, and conversion rates.
- Social Media Engagement: Monitor likes, shares, comments, and follower growth.
- Conversion Rates: Track how many visitors complete key actions like purchases or sign-ups.
Wrapping It Up
Customizing HubSpot dashboards transforms raw data into actionable insights tailored to your business goals. By focusing on key metrics, keeping layouts clean, and using visuals effectively, you can create dashboards that help you and your team make smarter decisions faster.
Start customizing your dashboards today and turn your data into a powerful decision-making tool.
News Letter
Subscribe our newsletter to get our
latest update & news


